Scroll:Data Handling >> Histogram >> mcq (4462)
Written Instructions:
For each Multiple Choice Question (MCQ), four options are given. One of them is the correct answer. Make your choice (1,2,3 or 4). Write your answers in the brackets provided..
For each Short Answer Question(SAQ) and Long Answer Question(LAQ), write your answers in the blanks provided.
Leave your answers in the simplest form or correct to two decimal places.
| 1) Draw the histrogram with the help of the following table.
( ) |
| 2) In a study of diabetic patients in a village, the following observations were noted.
( ) |
| 3) Draw the histrogram with the help of the following table.
( ) |
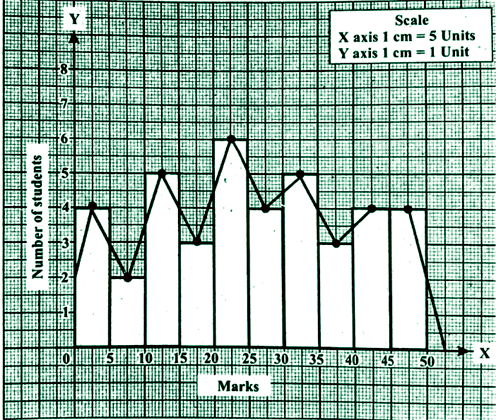
| 4) The following are the marks obtained by 40 students in an english examination ( out of 50 marks ) . Draw the histogram and frequency polygon for the data. 29, 45, 23, 40, 31, 11, 48, 1, 30, 24, 25, 29, 25, 32, 31, 22, 9, 49, 19, 13, 32, 39, 25, 3, 27, 41, 12, 13, 2, 44, 7, 43, 15, 35, 40, 3, 12, 48, 49,18. ( ) |
| 5) Draw the histrogram with the help of the following table.
( ) |
| 6) Draw the histrogram with the help of the following table.
( ) |
| 7) Draw the histrogram with the help of the following table.
( ) |
| 8) Draw the histrogram with the help of the following table.
( ) |
| 9) Draw the histrogram with the help of the following table.
( ) |
| 10) Draw the histrogram with the help of the following table.
( ) |
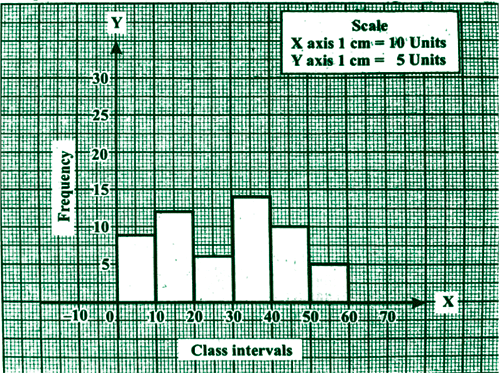
| 1) Draw the histrogram with the help of the following table.
|
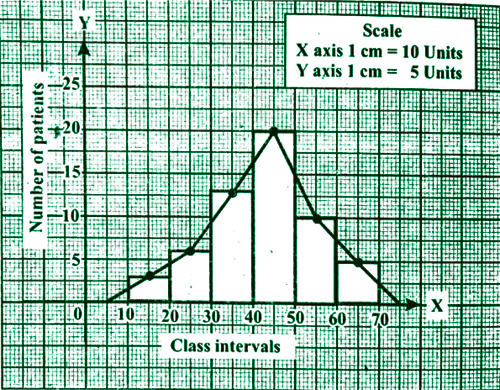
| 2) In a study of diabetic patients in a village, the following observations were noted.
SOLUTION 1 : Mark the class intervals along the X-axis and the frequencies along the Y-axis with appropriate scale.
|
| 3) Draw the histrogram with the help of the following table.
|
| 4) The following are the marks obtained by 40 students in an english examination ( out of 50 marks ) . Draw the histogram and frequency polygon for the data. 29, 45, 23, 40, 31, 11, 48, 1, 30, 24, 25, 29, 25, 32, 31, 22, 9, 49, 19, 13, 32, 39, 25, 3, 27, 41, 12, 13, 2, 44, 7, 43, 15, 35, 40, 3, 12, 48, 49,18. SOLUTION 1 : Range = Highest value - lovest value = 49 - 1 = 48. Let us divide the given data into 10 classes. Length of the class interval = Range / Number of class interval = = 4.8 =5
|
| 5) Draw the histrogram with the help of the following table.
SOLUTION 1 :
|
| 6) Draw the histrogram with the help of the following table.
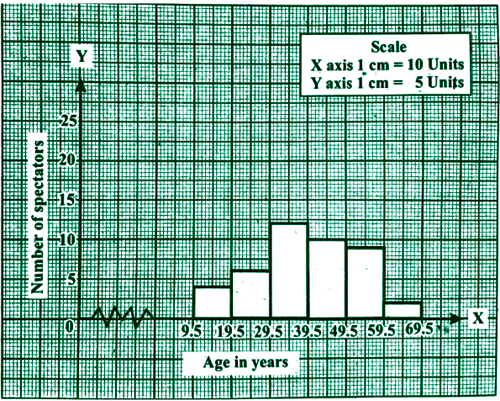
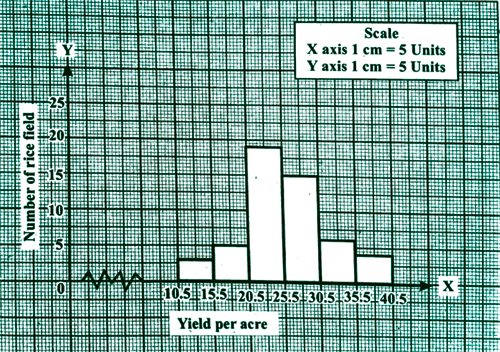
SOLUTION 1 : Adjustment factor = [ lower limit of a class interval - upper limit of the preceding class interaval ] In the above class interavals, we should subtract 0.5 from each lower limit and add 0.5 to each upper limit.
|
| 7) Draw the histrogram with the help of the following table.
|
| 8) Draw the histrogram with the help of the following table.
SOLUTION 1 : Adjustment factor = [ lower limit of a class interval - upper limit of the preceding class interaval ] In the above class interavals, we should subtract 0.5 from each lower limit and add 0.5 to each upper limit.
|
| 9) Draw the histrogram with the help of the following table.
SOLUTION 1 : Adjustment factor = [ lower limit of a class interval - upper limit of the preceding class interaval ] In the above class interavals, we should subtract 0.5 from each lower limit and add 0.5 to each upper limit.
|
| 10) Draw the histrogram with the help of the following table.
SOLUTION 1 : Adjustment factor = [ lower limit of a class interval - upper limit of the preceding class interaval ] In the above class interavals, we should subtract 0.5 from each lower limit and add 0.5 to each upper limit.
|
