Scroll:graph >> Quadratic graphs >> ps (4146)
Written Instructions:
For each Multiple Choice Question (MCQ), four options are given. One of them is the correct answer. Make your choice (1,2,3 or 4). Write your answers in the brackets provided..
For each Short Answer Question(SAQ) and Long Answer Question(LAQ), write your answers in the blanks provided.
Leave your answers in the simplest form or correct to two decimal places.
| 1) Answer:_______________ |
| 2) Answer:_______________ |
| 3) Draw the graph of the following equations: y=(x+2)(x+4)
Answer:_______________ |
| 4) Answer:_______________ |
| 5) Draw the graph of y = -3x2 Answer:_______________ |
| 6) Answer:_______________ |
| 7) Draw the graph of y = 2x2. Answer:_______________ |
| 8) Draw the graph of the following equation, y =3x2.
Answer:_______________ |
| 9) Draw the graph of the following equations, y = 2x2 - x + 3
Answer:_______________ |
| 10) Answer:_______________ |
| 1) Draw the graph of the following equations, y = 3x2 |
| 2) Draw the graph of y= x2+3x+2. SOLUTION 1 :
Plot the points & join the points by a smooth curve. The curve so obtained, is the graph of y = x2 + 3x + 2
|
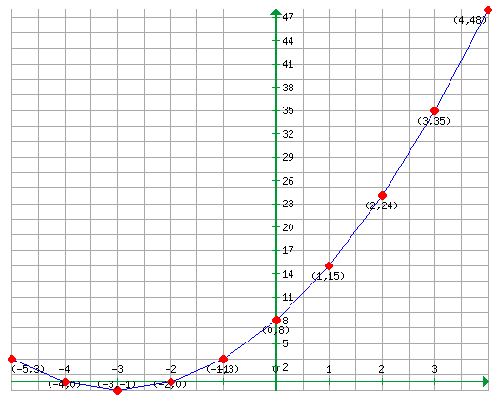
| 3) Draw the graph of the following equations: y=(x+2)(x+4)
SOLUTION 1 :
join the points by smooth curve. this curve is called the parabola y=(x+2)(x+4)
|
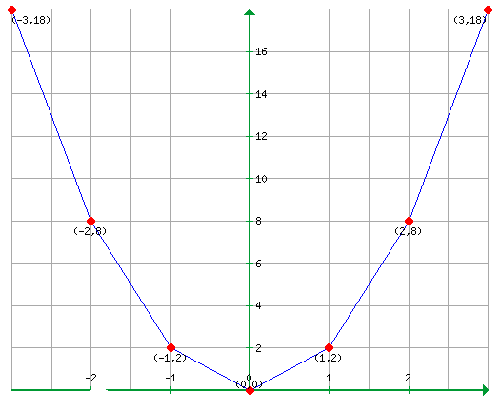
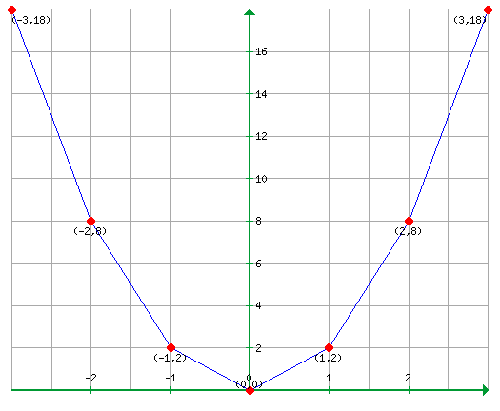
| 4) Draw the graph of y = 2x2. SOLUTION 1 :
plot the points & joint as a smooth curve.
|
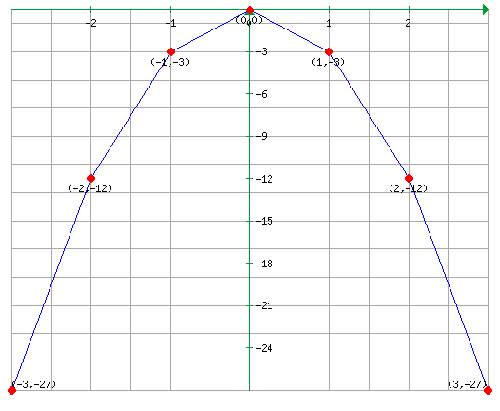
| 5) Draw the graph of y = -3x2 SOLUTION 1 : Let us assign the integer values from -3 to 3 for x and form the following table.
Plot the points & join the points by smooth curve. The curve thus obtained is the graph of y = 3x2 |
| 6) Solve the graphically 2x3 + x - 6 = 0. SOLUTION 1 :
Plot the points & Joint the points by a smooth curve.
|
| 7) Draw the graph of y = 2x2. SOLUTION 1 : First let us assign the integer values from -3 to 3 for x and form the following table.
Plot the points Join the points by a smooth curve. Thecurve, thus obtained is the graph of y = 2x2 |
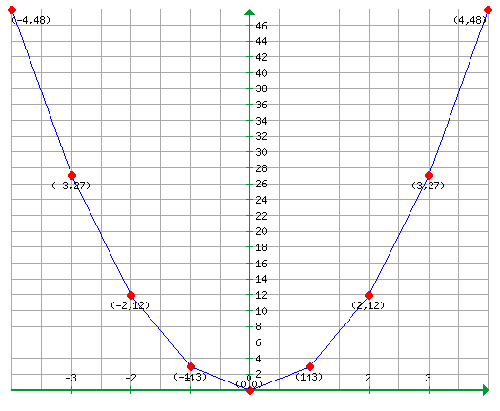
| 8) Draw the graph of the following equation, y =3x2.
SOLUTION 1 :
Plot the points & join the points by a smooth curve. This curve is called the parabola y=3x2. |
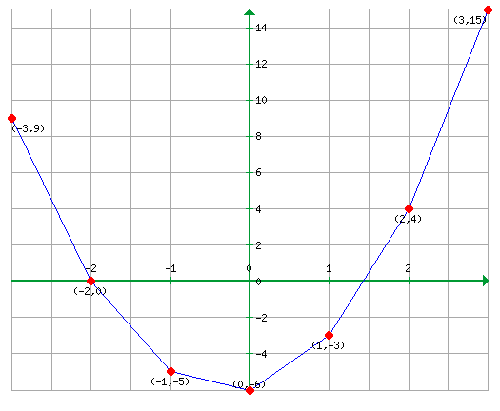
| 9) Draw the graph of the following equations, y = 2x2 - x + 3
SOLUTION 1 :
Plot the points & join the points by a smooth curve. this curve is called parabola y = 2x2 - x + 3
|
| 10) Draw the graph of the following equations: y= -4x2. |

